MENTOR STEP 4
STEP 1
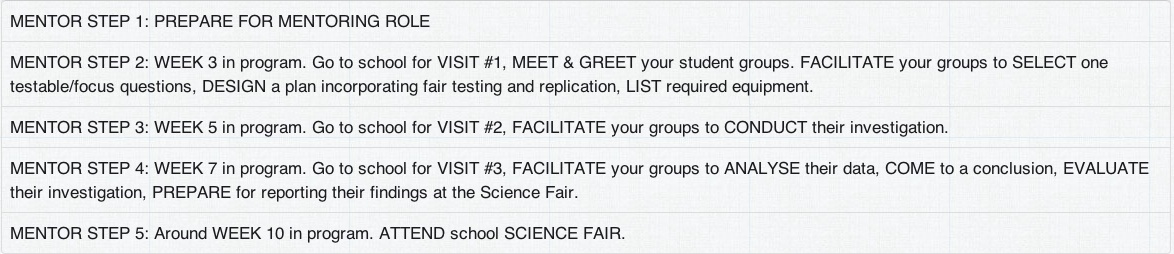
Preparation for Mentoring
STEP 2
School Visit #1
STEP 3
School Visit #2
STEP 4
School Visit #3
STEP 5
Attend Science Fair
Goals for STEP 4
- Attend SCHOOL VISIT #3
- Facilitate DATA PROCESSING, ANALYSIS and REPORTING
- Facilitate CONCLUSION and EVALUATION of investigation
Scroll down for more information.
STEP 4 – Plan Ahead
- SCHOOL VISIT #3: attend
- DATA PROCESSING, ANALYSIS & REPORTING: facilitate
- CONCLUSION & EVALUATION: facilitate
STEP 4 is in Week 7 of School Implementation
STEP 4 – Information
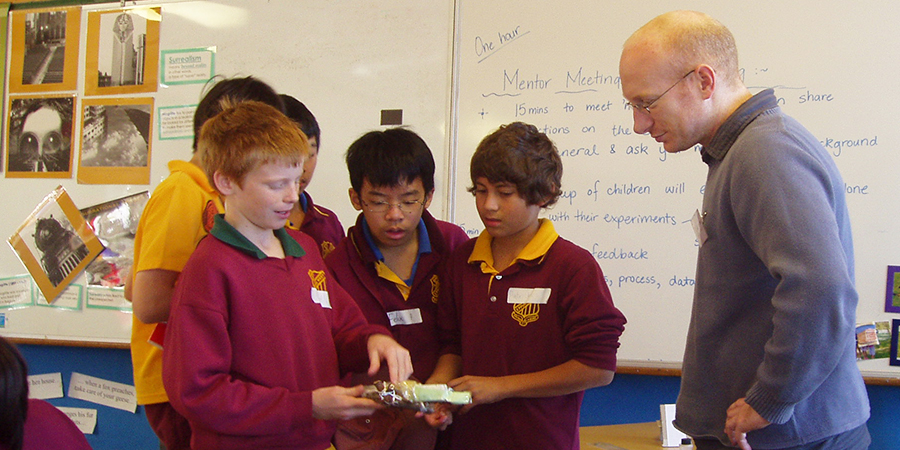
School Visit #3
- This is the THIRD and FINAL school visit. Between your last visit and this one students should have begun the process of turning their data into tables and graphs. You need to continue this process with a view to discussing what can be concluded FROM THE DATA.
- Students also need to evaluate their investigation considering aspects such as: what worked, what didn’t work, what would they do another time, how could the investigation be extended or progressed.
- Remember: The point of a scientific investigation is NOT to PROVE A PREDICTION or HYPOTHESIS. Data is data. What does the data show? An investigation is considered to be HIGHLY SUCCESSFUL when it is a fair test, when there is replication and when the data is meticulously collected – it is not about ‘getting the result that I thought I would’.
Resource (below) contain videos of Year 6 students explaining their findings of investigations from a class theme of GLOBAL ISSUES.
- Melting Ice on Land & in Water
- Amount of Sugar in Drinks #1
- Amount of Sugar in Drinks #2
Data Processing, Analysis and Reporting
The purpose of this step is to have students record their data in tables, create appropriate graphs and to analyse what their data demonstrates. The classroom teacher should have begun this process in the previous week, which you will continue, with a view to students reporting their findings at the Science Fair.
A number of the Resources (below) provide information that may assist you in this phase of MyScience:
- Literacy and Numeracy Video presents teachers who describe how literacy and numeracy skills can be developed through MyScience.
- Processing Data – Introduction provides an overview of the step.
- Data Analysis Expectations presents information about stages of learning related to students’ ability to analyse data.
- Data Tables describes the components of a table.
- Data Averaging provides information about averages, stem & leaf plots, median, mode and mean.
- Graphing discusses the type of graph needed to suit different types of data.
- Hypotheses presents a data set to be analysed.
- Gatorade Video presents students who report on their investigation into the effectiveness of a sports drink and critically reflect on their data.
Conclusion and Evaluation
Students need to use their collected data to come to a conclusion and to evaluate their investigation. The following Resources may provide useful information:
- Student Reflections presents a video of students reporting about their investigation comparing boys’ and girls’ memory. Note how students reflect about areas for improvement on their investigation.
- Critical Analysis presents questions for students about the RELIABILITY of their data such as: Have they taken enough measurements? Are the measurements over a wide enough range?
- Making Generalisation provides information about the need to take care when extending the results from a small scale classroom investigation to the outside world where many more factors come into play in complex settings.